


 Try for free

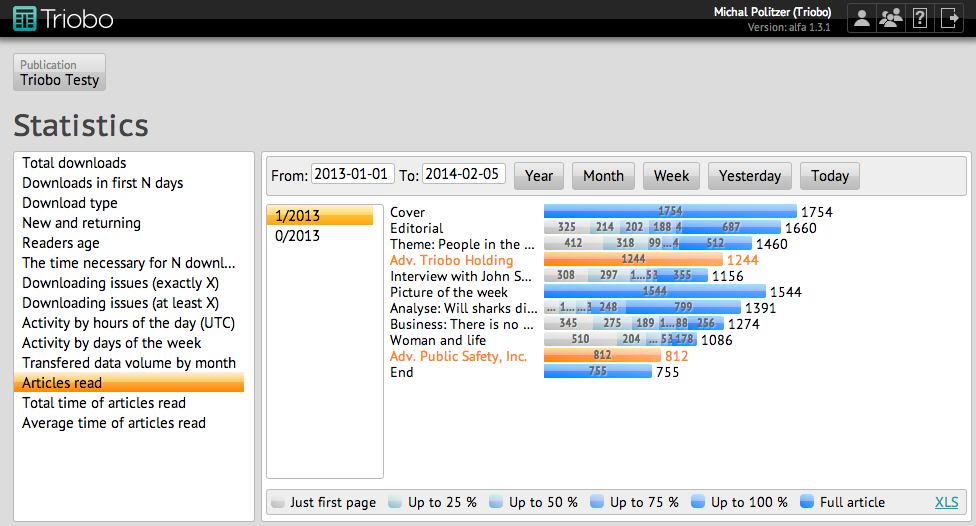
In this version we have added detailed article statistics, and also added a couple of peeks at issue download statistics.
A new feature is the ability to monitor whether the issue was downloaded by new or returning readers. This statistic also has a third category which we call “returning back readers”. Imagine a monthly magazine and a reader X, who has first downloaded the number 6 issue in June. Therefore with this issue he was registered as a “new reader”. Later, as new issues 7, 8, 9 … will be downloaded he will be categorized as a “returning reader”. However when he downloads the number 4 issue, which was already published before he become a magazine reader, he will be then registered as a “returning back reader”.
This picture reveals more (all numbers are made-up):
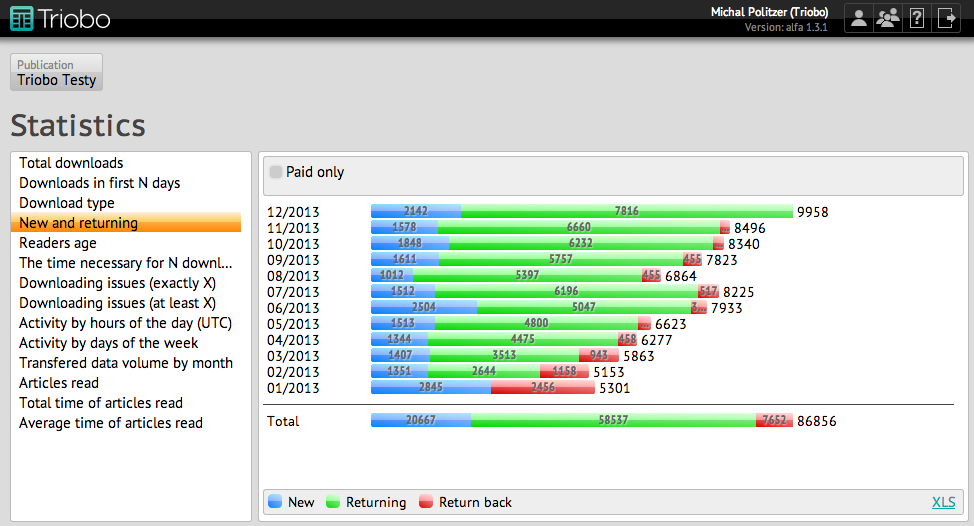
Download Statistics: new versus returning readers
If we can specify which issue was downloaded by a specific reader, we can than go even further with this analysis: the reader may be categorized by the month in which he has first downloaded something. Therefore we will display all issues that were later downloaded by him. A clever map will be created that shows readers by their age. With each edition, new readers will download new and older issues will appear as so:
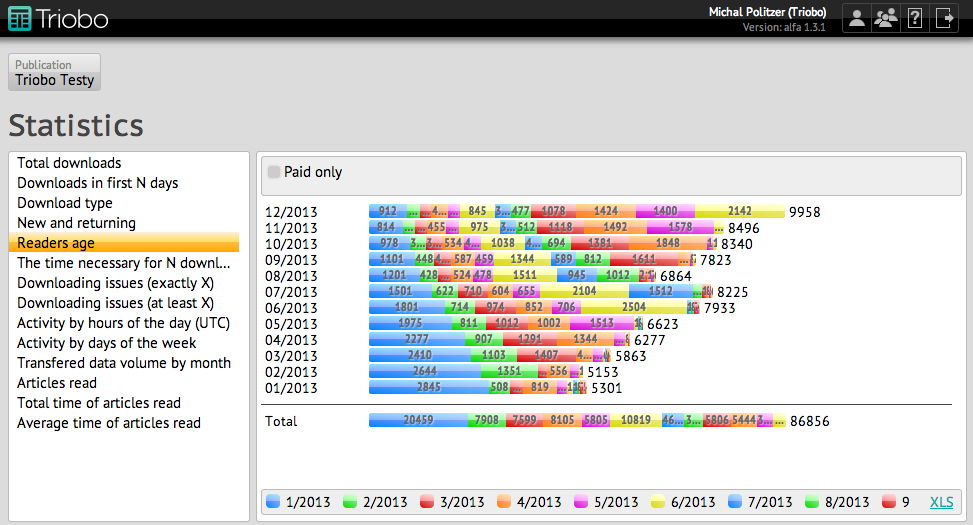
Distribution of readers according to the month in which they began magazine downloading
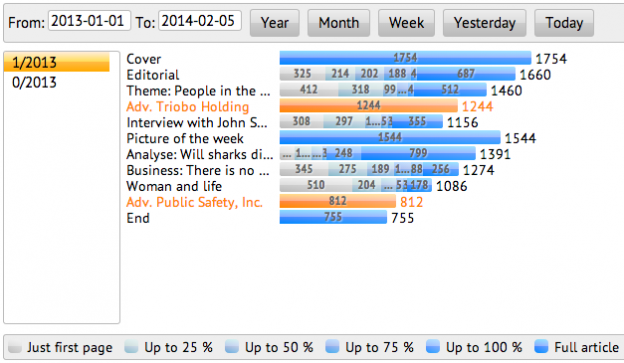
Detailed article statistics can also show the interest of readers in individual articles. Not only does it follow that the reader was reading an article (measuring the time), but we may also monitor how far throughout the article he/she has scrolled. With one-page articles it is always 100%, but with longer articles (paged or smooth scrolling) readers may be grouped into six groups. The lightest color displays the ones who did not scroll through the article at all – they have seen only the beginning of the article. The four other categories consist of those who came to less than a quarter, half, three quarters, or have just reached the end of the article. The last category (darkest color) shows the ones who have read all the way to the end of article.
Article statistics and the percentage of the article the readers have read
Color-coded lines: the publisher has labeled as advertising.
Furthermore, we can show the total time spent on individual articles, as well as the average time spent.
More can be found in the Knowledge Base.